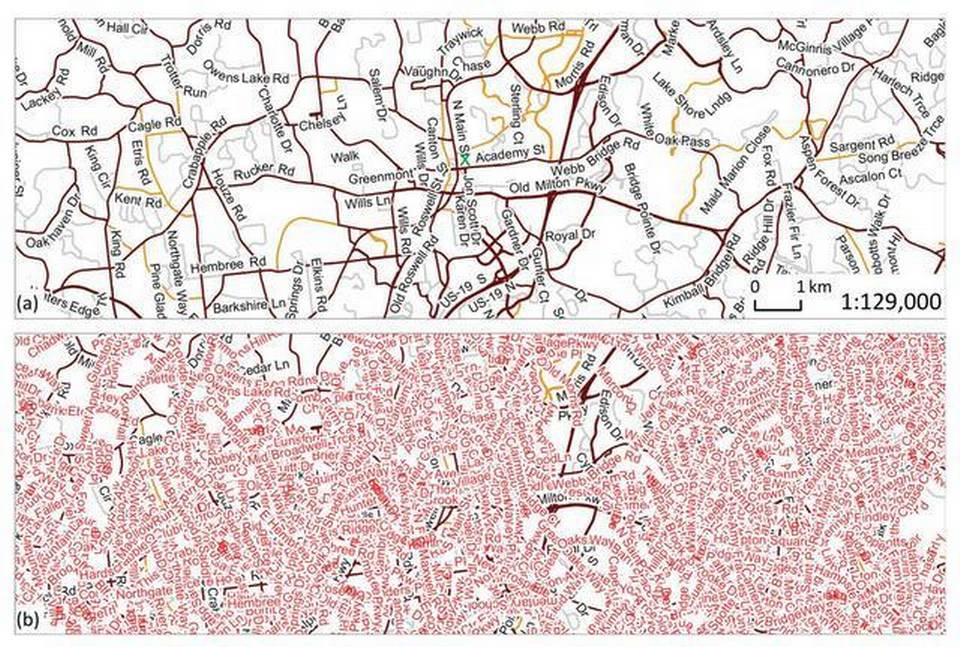
Digital maps: Most of us have used them for things like getting driving directions or searching for a specific place, such as a local business. We are accustomed with how the map’s features change as we zoom in and out. But how does what is displayed, or how it is visualized, change based on the zoom level? That is a complicated process and is an ongoing research focus for Cindy Brewer, professor and head of Penn State’s Department of Geography.

One of Brewer’s projects involves collaborating with the U.S. Geological Survey on U.S. Topo — a multiyear project launched in 2009 to create the next generation of digital topographic maps that retain the look and feel of the iconic USGS 7.5-minute quadrangle paper topographic series.
Paper quadrangle maps were plotted by hand, were drawn at a scale of 1:24,000 (1 inch equals 2,000 feet) and covered a fixed area of 7.5 minutes of latitude and longitude. The new digital U.S. Topo maps are modeled on the 7.5-minute quadrangle maps but are mass-produced from national GIS databases on a three-year repeating cycle.
U.S. Topo maps are based on data provided through the National Map — a collection of national geospatial databases. Geographic information available in the National Map includes data such as land cover, transportation, boundaries, orthoimagery (aerial photographs), elevation, hydrography, geographic names and structures.
The new digital U.S. Topo maps and the National Map viewer are interactive, unlike their paper predecessors, and users have the ability to turn data layers on and off, change zoom level and view them at multiple scales, which presents many design challenges.
Readability is critical to U.S. Topo, particularly because the maps service a diverse user base with multiple viewing environments. Brewer’s goal is to improve the look and readability of the National Map’s visual products across all map scales.
“To keep this readability working through different scales, we make decisions about smartly partitioned processing that gradually eliminates less important features as map areas get smaller in broader views,” Brewer said. “For example, the category of local roads is a very big category. You might have a few state roads and highways, but everything else is local. We can’t just say at some scale we are arbitrarily going to take local roads off the map.”
In the earlier phases of the project, Brewer worked with USGS staff on map redesign and display improvements for a range of scales from 1:5,000 to 1:1,000,000. Her innovations in the use of color, symbols and generalization informed a USGS standard for generating topographic maps.
“You would be surprised how much computer programming is involved in map design. We are using tools in Geographic Information System software that run through the road network and figure out what roads have the most connectivity with all the other roads. This provides a weight on the importance of that road in the larger network,” Brewer said. “I am trying to come up with some additional data attributes that give me a hierarchy of importance. So for roads, it’s how busy are they in the sense of the network traffic. Within a local road category, I want to know which are the more important local roads. I want to give them bigger labels and I want them to persist systematically through scale.”
In the latest phase of the project, Brewer is focusing on map labels and label rules for appearance, readability, positioning and generalization.
“Label rules that automatically create and place labels in a competent, readable manner are crucial for automating map production,” Brewer said.
In addition to being useful for things like resource management and recreation, US Topo maps are essential for disaster response and homeland security.
“When the 1:24K quadrangle maps program was stopped as a paper product, maps on average were 24 years old. Part of the political will to improve on that was related to disaster response,” Brewer said. “The first maps to be redesigned and available online for were for a band 200 miles wide along the coast in southeast United States for hurricane damage.”
“Having mapping for emergency response groups is crucial. We really need a competent set of spatial data for everywhere in the country. We need really good mapping, not just good road mapping. We need terrain form, land cover, all kinds of things,” Brewer added.
Brewer said she has always been interested in graphics.
“As a kid, I did a lot with mapping. My family did a lot of hiking and camping in northern Ontario and used a lot of topo maps,” she said. “I have the whole analytical side to me, but I really value the graphic challenge as well as the analytical challenge of maps so this is really kind of a natural topic for me.”
Learn more about U.S. Topo maps.
This story originally appeared in the Centre Daily Times on March 28, 2015.

